We wanted to share a new MeshScope page that gives you a detailed internal view of the mesh data processing. Our MeshScope dashboard shows the statistics on the dozens of messages received every minute, the type and topcs of messages, and other interesting characteristics. Also included are internal functions such as processing queues, per-message metrics, and external service calls. As MeshScope is a Java-based application, it also shows the internal Java Virtual Machine (JVM) information, which is useful to ensure application health and stability.
Feel free to check out the dashboard at:
https://meshscope.lemuridaelabs.com/dashboard
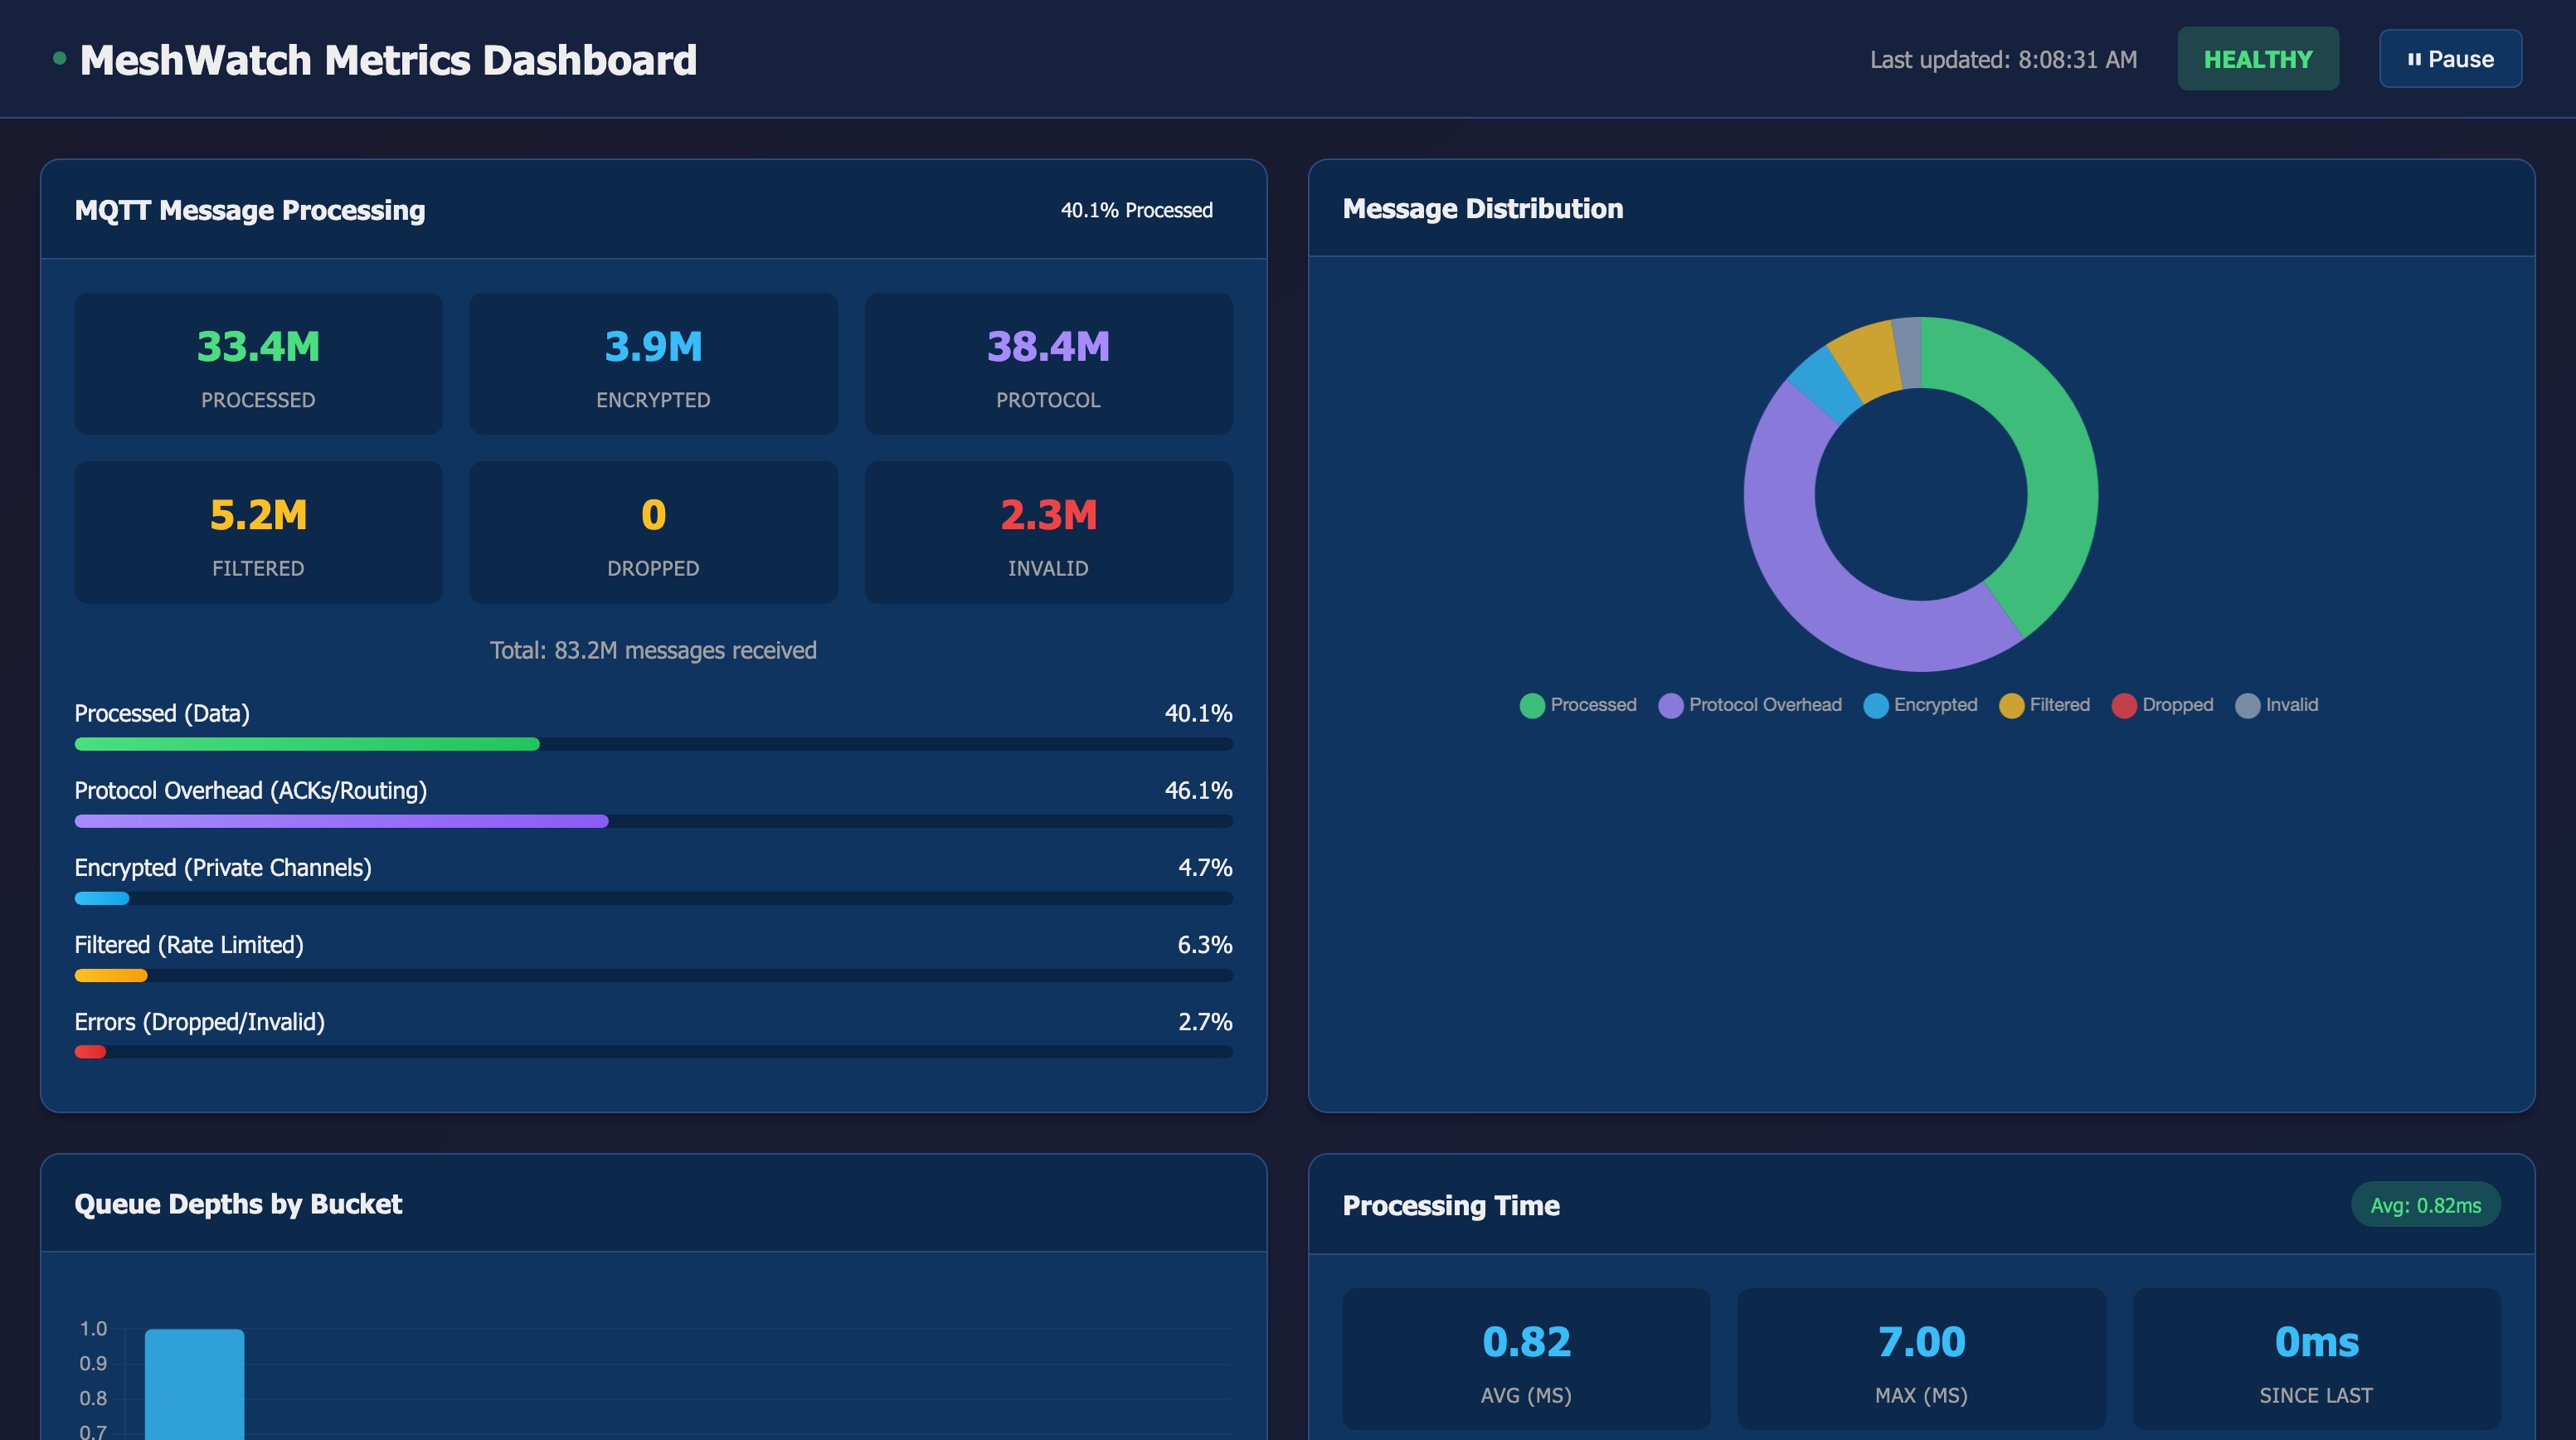
An example of the dashboard, showing some processing information and the start of statistics is shown below. To see the full dashboard and all of the statistics and details, simply click the link above.
We enjoy collaboration and are always happy to share and work with others. If you have thoughts or new ideas, feel free to reach out!